Bar-by-Bar Forensics: NASDAQ.QQQ Wedge Channel Reversal (pa-wedge-reversal) Execution & Alpha Attribution
This study is integrated with MarketSightAI's dynamic engine. Launch the session to verify micro-causality.
Executive Summary: Combining a 5-step bar-by-bar causal chain, 4-stage lifecycle state machine, and 10-year quantitative expectancy matrix to eliminate hindsight bias on NASDAQ.QQQ.
1. The Hindsight Illusion in K-Line Charting
When you look at a completed intraday chart after the market closes, every reversal and trend continuation looks obvious. Your eye naturally gravitates toward the exact swing low or high, ignoring the five choppy bars that shook out real-time traders minutes earlier.
To trade Price Action systematically, you must answer two questions at the exact close of Signal Bar #N—with zero knowledge of Bar #N+1:
- Microscopic Causality: Does the current bar’s anatomy, EMA deviation, and multi-timeframe context justify placing a stop order 1 tick beyond its extreme?
- Macroscopic Base Rate: Over thousands of historical occurrences, does this exact setup have a positive mathematical expectancy (
Expected Value: WinRate × RewardRatio minus LossRate)?
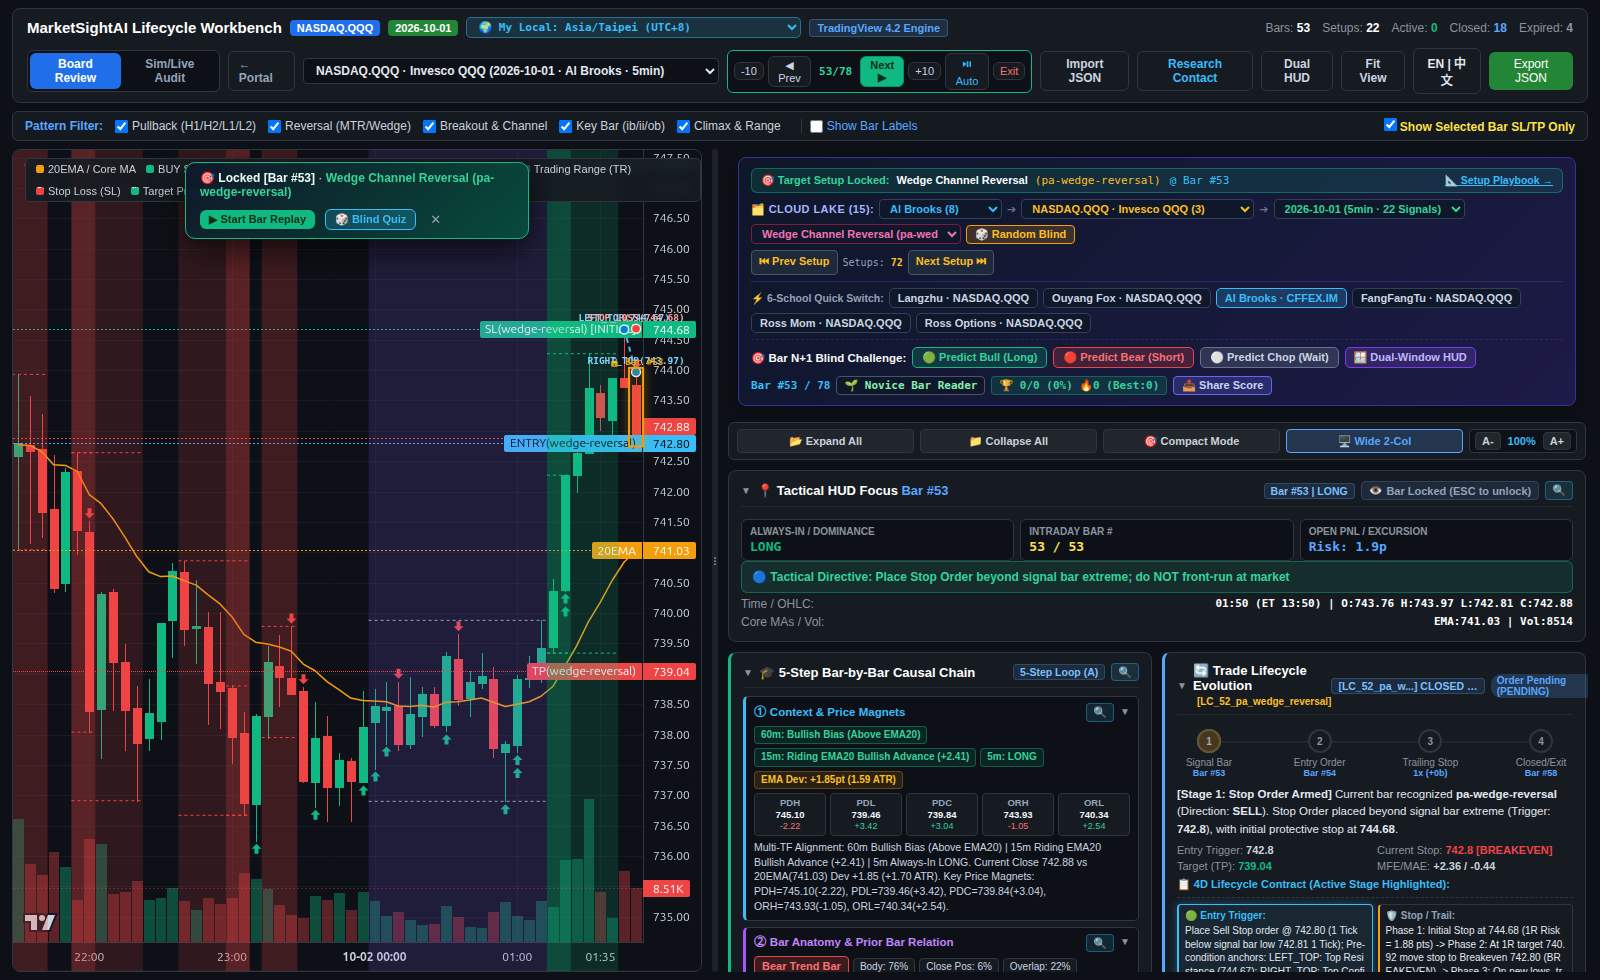
Let’s dissect a real session on NASDAQ.QQQ (Invesco QQQ · 2026-10-01 5min) right at Bar #53 (13:50), using the Al Brooks Price Action (BPA) lens on MarketSightAI.
2. Freezing the Chart at Bar #53 (13:50)
Before revealing how the session unfolded, you can open this exact bar in Interactive Blind Replay Mode (which hides Bar #54 onward so you can test your own read).
Here is the exact telemetry emitted by the engine at the close of Bar #53:
- Symbol & Market:
NASDAQ.QQQ(Invesco QQQ · US Equities & ETFs) - Signal Bar #53 OHLC: Open
743.76| High743.97| Low742.81| Close742.88| Volume8514.0 - 20EMA Reference:
741.03| Always-In Dominance: LONG - Recognized Setup: Wedge Channel Reversal (
pa-wedge-reversal) — Canonical Class: Reversal
The 5-Step Bar-by-Bar Causal Chain
STEP 1 · Macro Context & Price Magnets
Multi-TF Alignment: 60m Bullish Bias (Above EMA20) | 15m Riding EMA20 Bullish Advance (+2.41) | 5m Always-In LONG. Current Close 742.88 vs 20EMA(741.03) Dev +1.85 (+1.70 ATR). Key Price Magnets: PDH: 745.10(-2.22), PDL: 739.46(+3.42), PDC: 739.84(+3.04), ORH: 743.93(-1.05), ORL: 740.34(+2.54).
STEP 2 · Single-Bar Anatomy & Progression
Classified as Bear Trend Bar (Body 75.9%, Close Pos 6.0%, Overlap 21.6%). Prior Bar Relation: High stayed below prior high (744.67) forming Lower High (LH), Low broke below prior low (743.72) forming Lower Low (LL), Confirmation: Bar Bear Signal (pa-exhaustion-gap) Low Confirmation Entry (Follow-through Confirmed).
STEP 3 · Pattern Anchor & Regime Gate Filtering
1 Pattern: (pa-wedge-reversal(SELL/COUNTER_TREND_SCALP) Anchors: Left Top at Bar #51 (744.67) to Right Top at Bar #52 (743.97)) — Regime Filter: Detected Pattern, but blocked due to steep EMA20 slope (+0.29) and price above EMA.
STEP 4 · Tactical Verdict & Order Placement
Primary Directive: 🟡 Bull Dominance Counter-Trend / Signal (pa-evening-star): or Buyers Take-Profit. Bar (1): pa-wedge-reversal(A EV: +0.17: Entry: 742.80, Stop-Loss: 744.68, Target: 739.04).
STEP 5 · Bar #54 Watershed & Invalidation
Lifecycle Ledger: ( pa-barbed-wire-breakout:CLOSED_OPPOSITE_SIGNAL, pa-exhaustion-gap:TRIGGERED_ENTRY, pa-wedge-reversal:NEW_SIGNAL_PENDING). Next Bar (Bar #53) Watershed: Break above 743.98 triggers/extends bullish momentum, break below 742.80 triggers bearish breakdown or negates bull signal bar.
3. The 4D Lifecycle Contract & Sim/Live Friction Audit
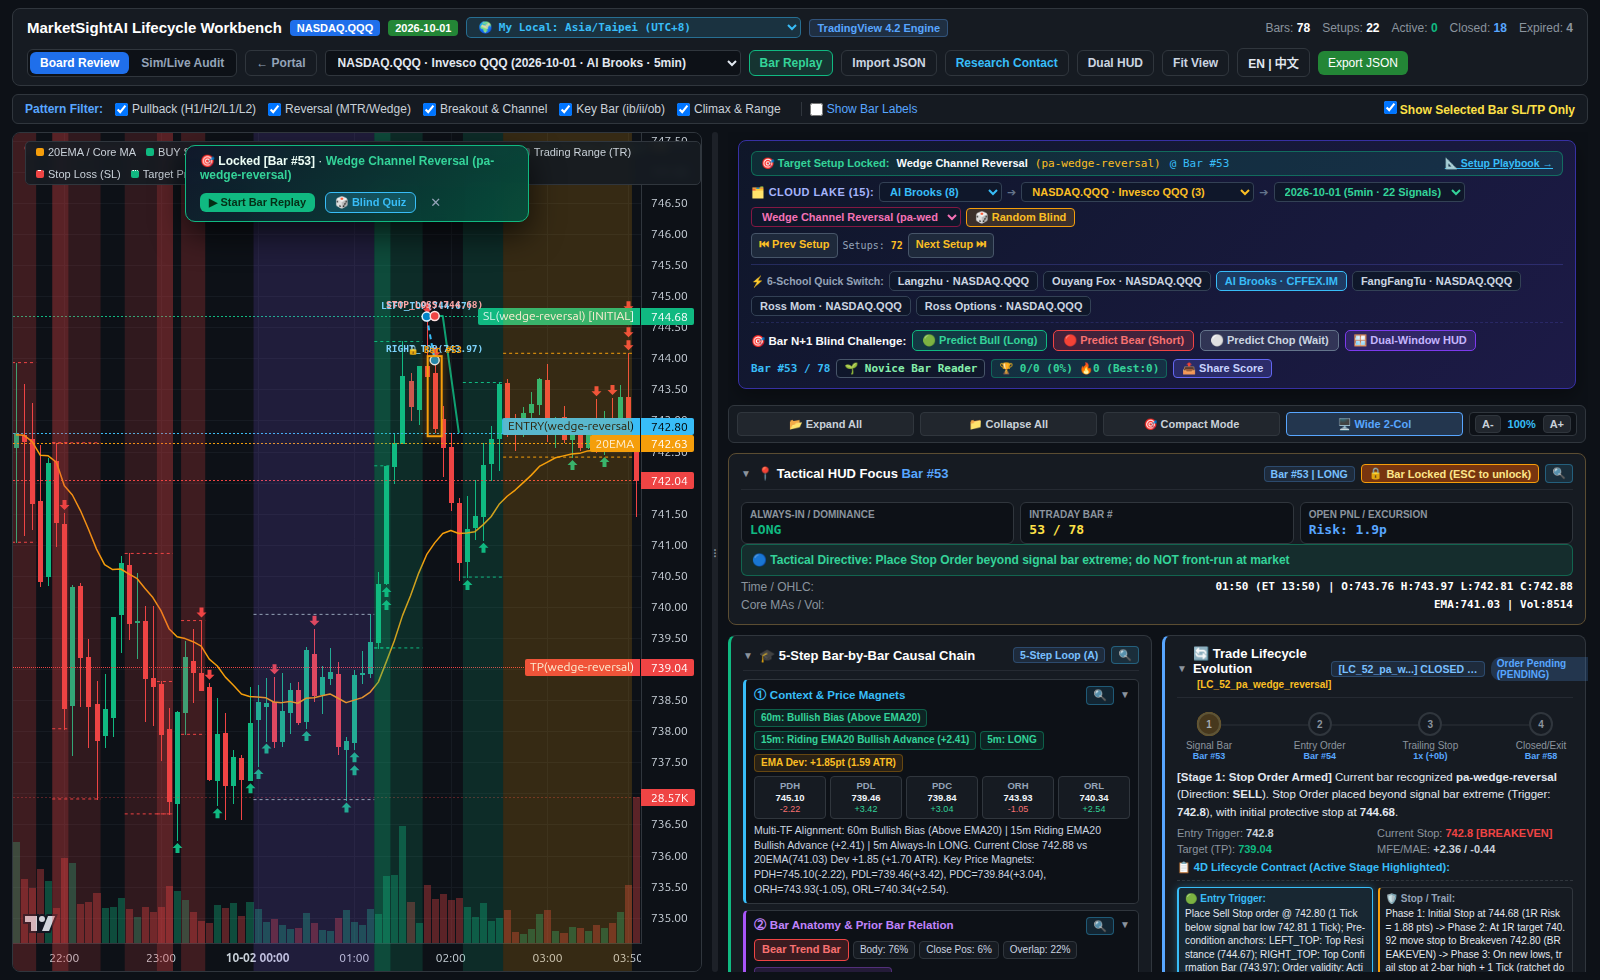
Unlike static chart annotations that merely draw an arrow under a bar, every setup in MarketSightAI’s Lifecycle Workbench is governed by a deterministic 4-stage state machine (PENDING → ENTRY_TRIGGERED → IN_POSITION (BREAKEVEN / TRAILING) → CLOSED / EXPIRED):
- 🟢 Entry Trigger (
SELL STOP):742.80 - 🛡️ Initial Structural Stop (
1R):744.68(Risk: 1.88 pts) - 🎯 Measured-Move Target (
TP):739.04(Reward/Risk: 2.00R) - 🏁 Actual Execution Outcome: Triggered on Bar #54, Ratchet-trailed to Bar #58 (
REVERSED_ON_OPPOSITE_SIGNAL), realizing+0.00 pts.
💡 Pro Tip — Board Review vs. Sim/Live Audit: In the top toolbar of the Workbench, click
⚡ Sim/Live Audit. It reconciles how a single-slot mutex (1 active position at a time), EV gating, and TCA slippage/commission affect net PnL compared to multi-slot educational board signals.
4. Same Chart, Multiple Tactical Schools
One of the best ways to sharpen your chart reading is to inspect how different systematic trading schools interpret the exact same K-line series. On NASDAQ.QQQ, you can switch between our tactical lenses with one click:
| Tactical School | Session Date | Active Setups | Core Methodology & Edge | Interactive Link |
|---|---|---|---|---|
| Al Brooks Price Action (BPA) | 2026-10-15 | 25 Setups | 20EMA pullbacks, 3-push wedges & 4-stage trailing stops | Open in Workbench → |
| Al Brooks Price Action (BPA) | 2026-10-13 | 21 Setups | 20EMA pullbacks, 3-push wedges & 4-stage trailing stops | Open in Workbench → |
| FangFangTu 2nd-Leg Trap PA | 2026-10-13 | 13 Setups | First weak pullback (H1/L1), 2nd-leg bear/bull traps & actual risk | Open in Workbench → |
| Ross Cameron Momentum | 2026-10-13 | 7 Setups | High RVOL, VWAP support & First Candle to Make a New High | Open in Workbench → |
| Langzhu Wave & Prime MAs | 2026-10-13 | 6 Setups | DKX trend line confluence, Wave-3 breakout & divergence inflection | Open in Workbench → |
| Ouyang Intraday Volume-Price | 2026-10-13 | 14 Setups | VWAP institutional support, ignition volume spikes & divergence-to-consensus | Open in Workbench → |
| Ross Cameron Options | 2026-10-13 | 8 Setups | High-RVOL equity breakout mapped to high-Gamma ATM/ITM options | Open in Workbench → |
| Al Brooks Price Action (BPA) | 2026-10-01 | 22 Setups | 20EMA pullbacks, 3-push wedges & 4-stage trailing stops | Open in Workbench → |
5. 10-Year Empirical Evidence: 54 Varieties × 47 Price Action Setups
How does Wedge Channel Reversal (pa-wedge-reversal) stack up against all 47 canonical Price Action setups across 54 futures varieties from 2015 to 2026?
pa-wedge-reversalEmpirical Stats:10,552trades |27.6%Win Rate |0.91Profit Factor |2.33RPayoff Ratio (View Fullpa-wedge-reversalPlaybook →).
Here are the Top 5 Highest Profit-Factor Setups in our 10-year empirical forensics matrix:
| Rank | Price Action Setup | Canonical Category | 10-Yr Trades | Win Rate P(Win) | Profit Factor | Payoff (R:R) |
|---|---|---|---|---|---|---|
| #1 | Tight Channel Progression (pa-tight-channel) | Breakout & Channel | 90 | 36.7% | 2.52 | 4.02R |
| #2 | Consecutive Trend Bars Impulse (pa-consecutive-bars) | Breakout & Channel | 30 | 36.7% | 1.81 | 3.13R |
| #3 | Outside Bar Expansion (ob) (pa-outside-bar) | Key Bar | 1,377 | 37.3% | 1.58 | 2.55R |
| #4 | Barbed-Wire Congestion Breakout (pa-barbed-wire-breakout) | Breakout & Channel | 17,035 | 38.0% | 1.55 | 2.5R |
| #5 | Breakout Test (BT) (pa-breakout-test) | Pullback | 10,112 | 37.2% | 1.55 | 2.56R |
You can plug any of these empirical Win Rates and Payoff Ratios directly into our Interactive Trader’s Equation & Half-Kelly Position Sizing Calculator.
6. Try the Interactive Bar-by-Bar Workbench Yourself
All core modules on MarketSightAI are 100% free in the browser (with automatic local timezone adaptation for US Eastern, Beijing/Shanghai, London, and UTC):
All articles, quantitative code, statistical models, and chart forensics published herein are strictly for algorithmic research, statistical deduction, and educational purposes. Nothing herein constitutes investment advice, financial planning, or a solicitation to buy or sell securities or derivatives. Trading involves substantial risk of capital loss.